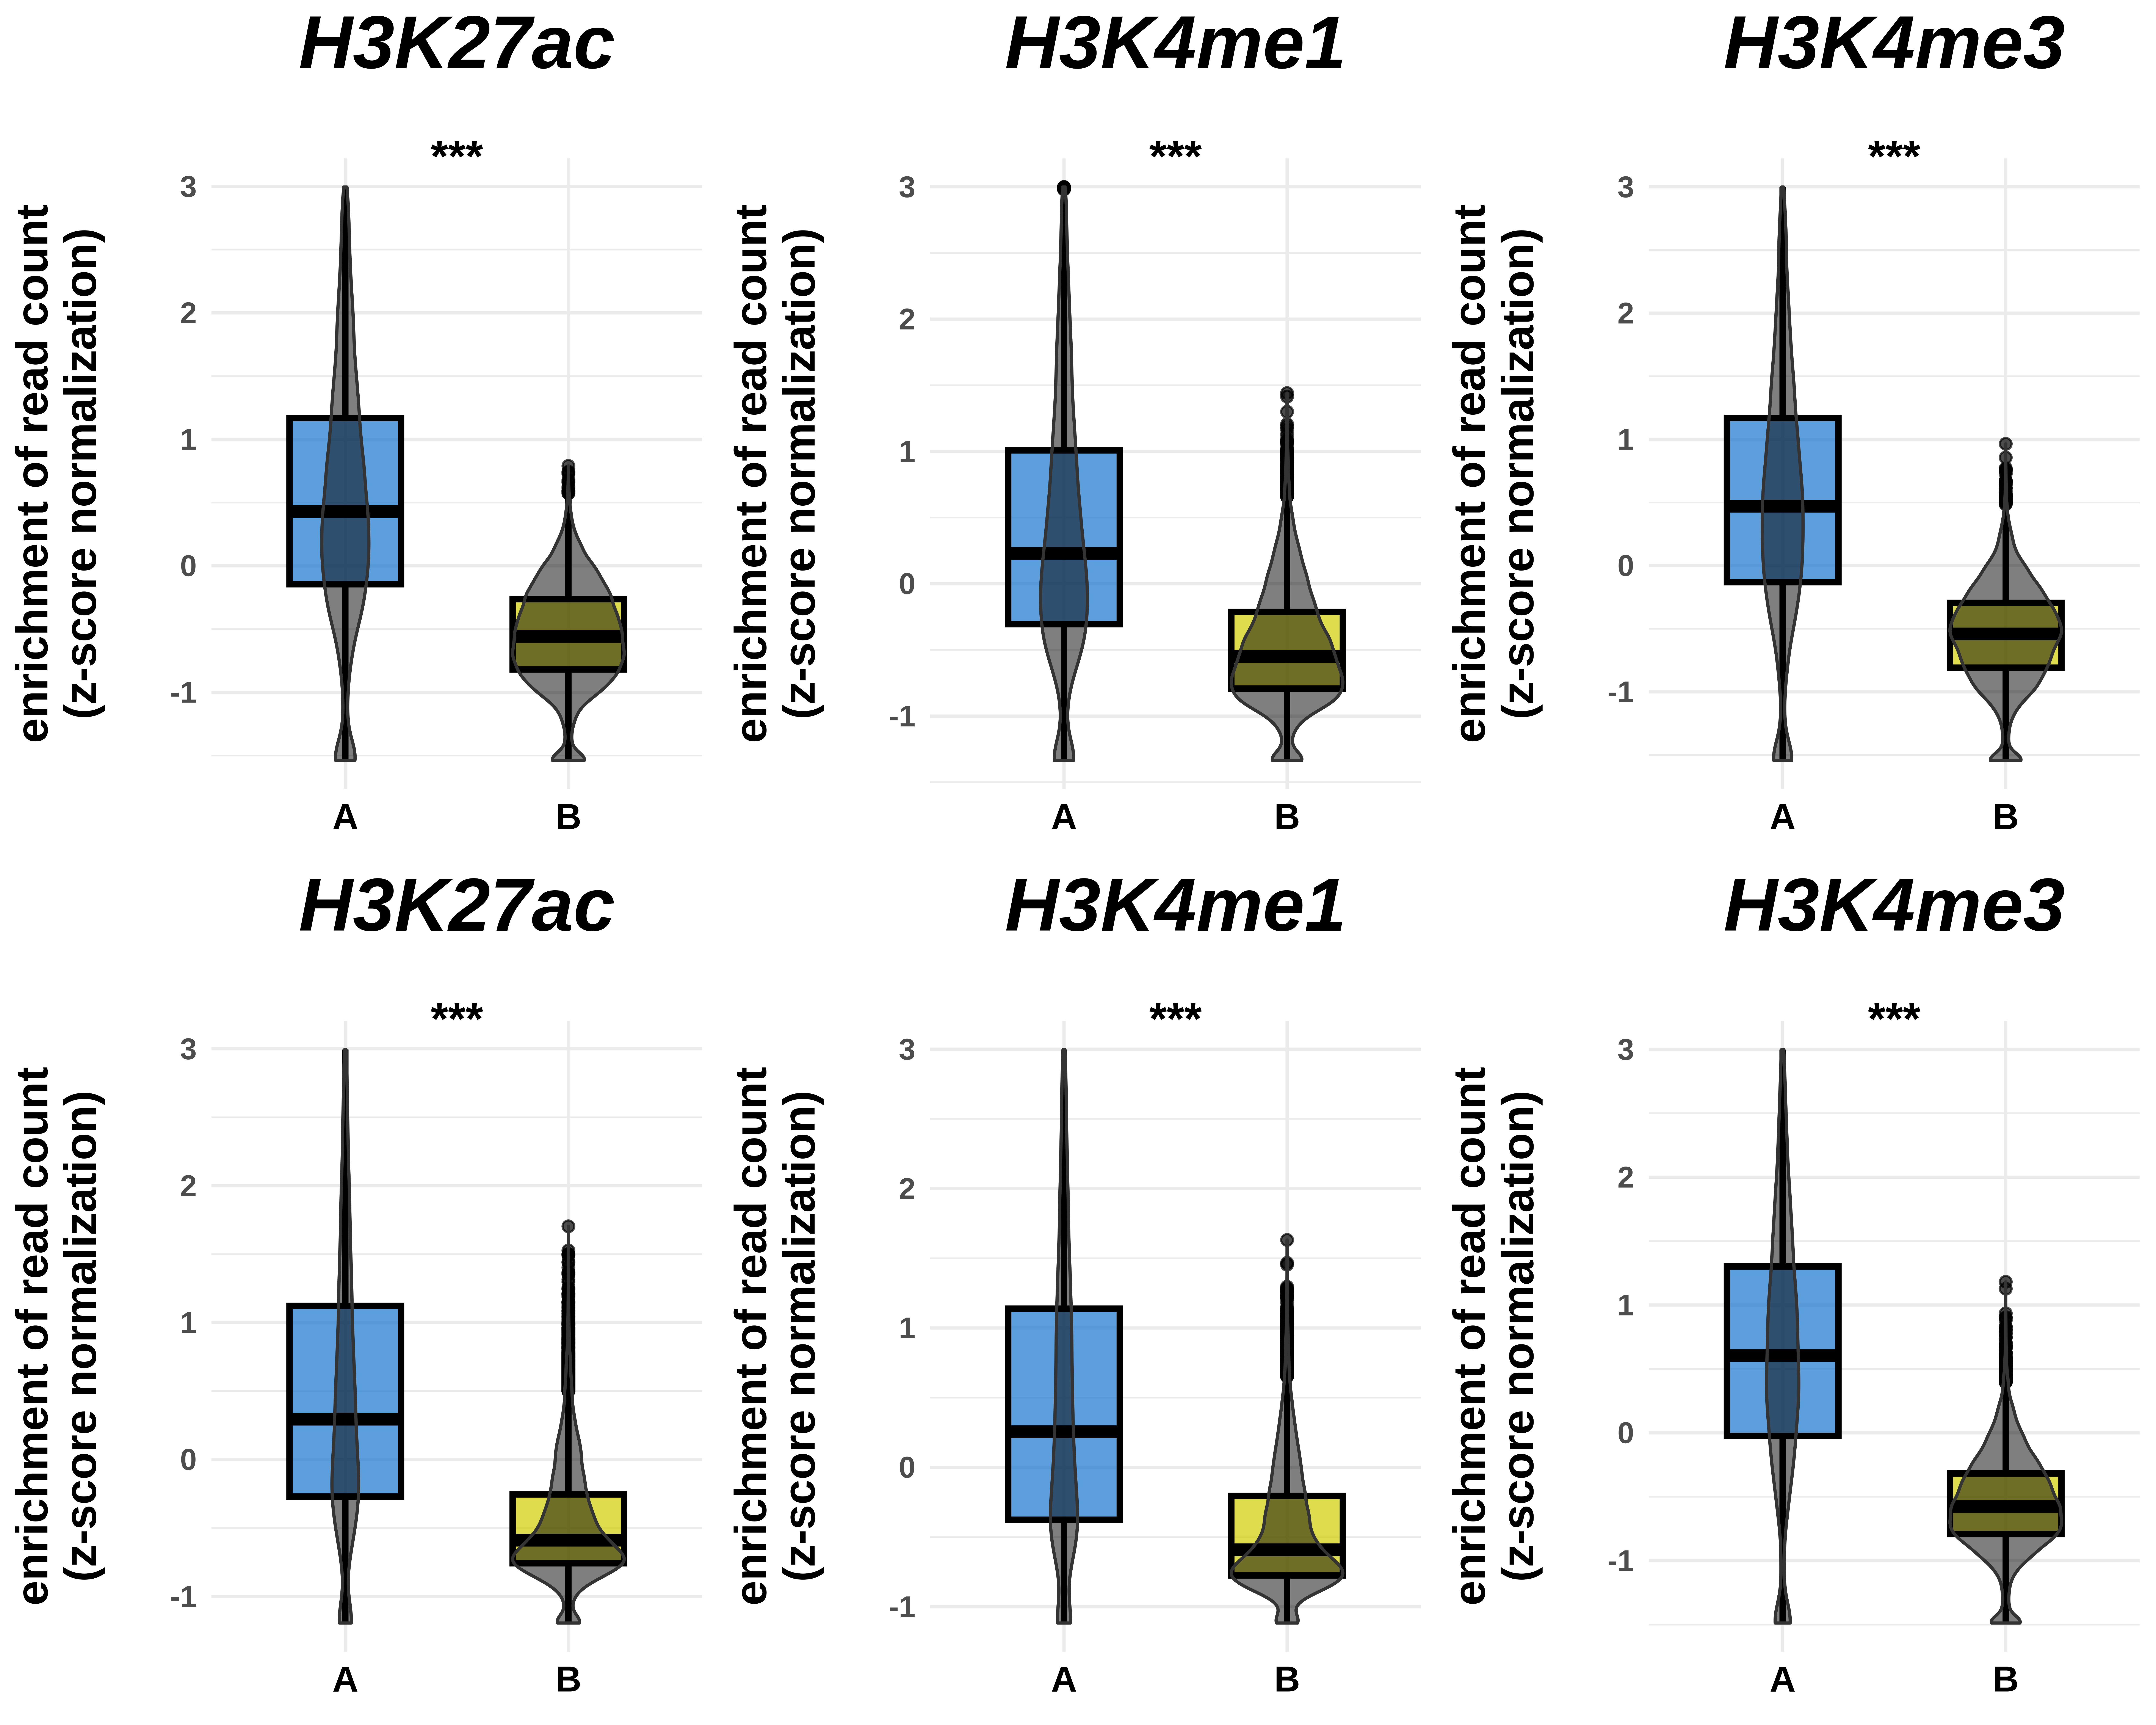
VP = function(inputpath,stage,histone){

Histone_MicroC = read.table(inputpath,sep = "\t", header=F,fill = TRUE)
Histone_MicroC_stage = Histone_MicroC[which(Histone_MicroC[,5] == stage),]
Histone_MicroC_stage_histone = Histone_MicroC_stage[which(Histone_MicroC_stage[,7] == histone),]

Histone_MicroC_A = Histone_MicroC_stage_histone[which(Histone_MicroC_stage_histone[,6] == "A"),1:4]
Histone_MicroC_B = Histone_MicroC_stage_histone[which(Histone_MicroC_stage_histone[,6] == "B"),1:4]

Histone_MicroC_A$value = Histone_MicroC_A[,4]/(Histone_MicroC_A[,3]-Histone_MicroC_A[,2])
Histone_MicroC_B$value = Histone_MicroC_B[,4]/(Histone_MicroC_B[,3]-Histone_MicroC_B[,2])

Histone_atA = Histone_MicroC_A[,4:5]
Histone_atB = Histone_MicroC_B[,4:5]

Histone_atA[,1] = "A"
Histone_atB[,1] = "B"

colnames(Histone_atA) = c("comp","value")
colnames(Histone_atB) = c("comp","value")

Histone_plot = rbind(Histone_atA,Histone_atB)

Histone_plot$z = (Histone_plot$value-mean(Histone_plot$value))/sd(Histone_plot$value)

Histone_plot = Histone_plot[which(Histone_plot$z >= -3),]
Histone_plot = Histone_plot[which(Histone_plot$z <= 3),]

test = wilcox.test(
    Histone_plot[which(Histone_plot[,1] == "A"),3],
    Histone_plot[which(Histone_plot[,1] == "B"),3],
    alternative = "two.sided"
)

    if(test$p.value <= 0.05){
        if(test$p.value > 0){
            anno = "*"}
        }
    if(test$p.value <= 0.001){
        if(test$p.value > 0.05){
            anno = "**"}
        }
    if(test$p.value <= 0.0001){
            anno = "***"}

options(repr.plot.width = 3, repr.plot.height = 4, repr.plot.res = 300, repr.plot.pointsize = 20)

ggplot(Histone_plot, aes(x=factor(comp), y=z, fill=factor(comp)))+
geom_boxplot(fill=c("dodgerblue3","yellow3"),
             size=1,
             color='black',
             width=0.5,
             alpha=0.7)+
geom_violin(adjust=1,
            width=0.5,
            scale='count',
            fill=c("black"),
            alpha=0.5)+
    guides(fill="none")+
theme_minimal()+
    labs(title=histone,
        subtitle = anno)+
    xlab("")+
    ylab("enrichment of read count\n(z-score normalization)\n")+
theme(plot.title=element_text(face="bold.italic",hjust=0.5,size=25,color = "black"),
      axis.text.x=element_text(face="bold",size=12,color = "black"),
      axis.text.y=element_text(face="bold",size=10),
      plot.subtitle=element_text(face="bold",hjust=0.5,vjust=-3,size=15,color = "black"),
      axis.title.x = element_text(size=0,color = "black"),
      axis.title.y = element_text(face="bold",size=15,color = "black"))
    }

