2D
ABcompartmentDATA = read.table("/data3/psg/Ets1/ProcessedData/ABcompartmentDATA.txt",sep = "\t", header=F,fill = TRUE)

GM_A = ABcompartmentDATA[which(ABcompartmentDATA[,4] == "GM_A"),]
GM_B = ABcompartmentDATA[which(ABcompartmentDATA[,4] == "GM_B"),]

OM_A = ABcompartmentDATA[which(ABcompartmentDATA[,4] == "OM_A"),]
OM_B = ABcompartmentDATA[which(ABcompartmentDATA[,4] == "OM_B"),]
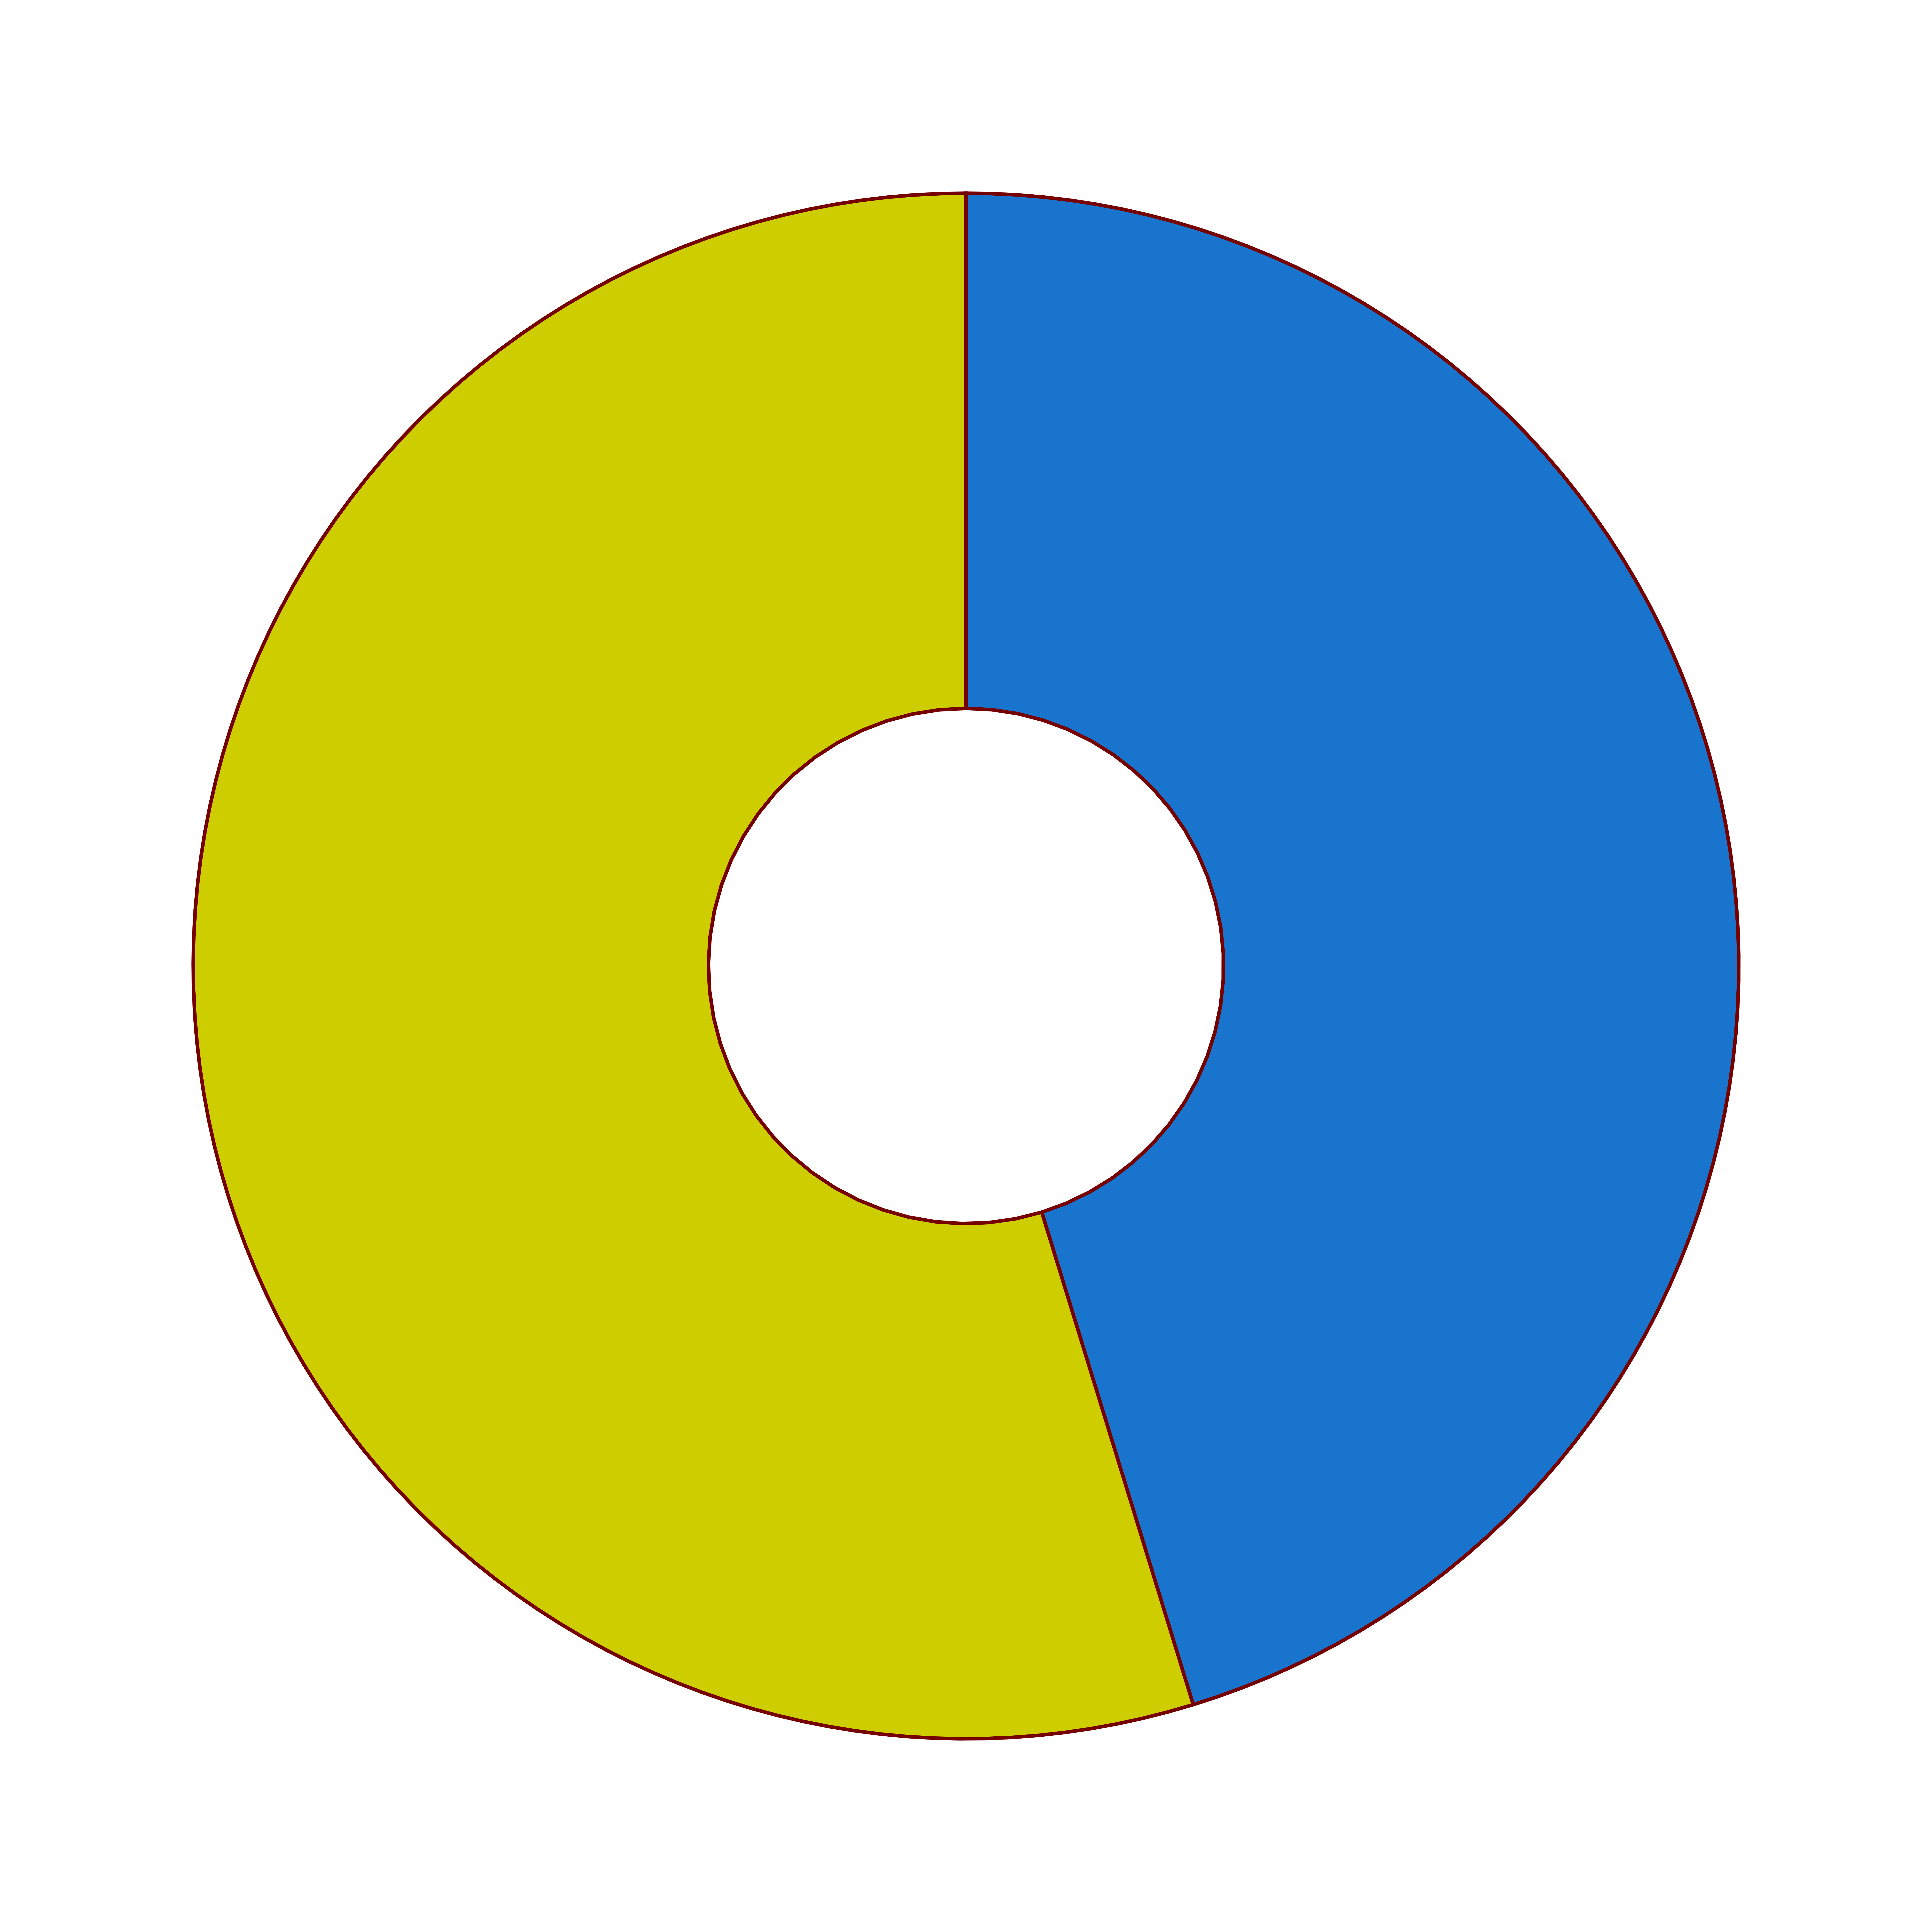
round(nrow(GM_A)/(nrow(GM_A)+nrow(GM_B))*100,2)
round(nrow(GM_B)/(nrow(GM_A)+nrow(GM_B))*100,2)
48.94 51.06
round(nrow(OM_A)/(nrow(OM_A)+nrow(OM_B))*100,2)
round(nrow(OM_B)/(nrow(OM_A)+nrow(OM_B))*100,2)
45.25 54.75
options(repr.plot.width = 8, repr.plot.height = 8, repr.plot.res = 1000, repr.plot.pointsize = 10)

data <- data.frame(
    category=c("B","A"),
    count=c(round(nrow(GM_A)/(nrow(GM_A)+nrow(GM_B))*100,2),
            round(nrow(GM_B)/(nrow(GM_A)+nrow(GM_B))*100,2))
)

data$fraction <- data$count / sum(data$count)
data$ymax <- cumsum(data$fraction)
data$ymin <- c(0, head(data$ymax, n=-1))
data$labelPosition <- (data$ymax + data$ymin) / 2

data$label <- paste0(data$category, "\n value: ", data$count)
nb.cols <- 19
mycolors <- colorRampPalette(brewer.pal(8, "Pastel2"))(nb.cols)

ggplot(data, aes(ymax=ymax, ymin=ymin, xmax=4, xmin=3, color = "grey",fill=category)) +
geom_rect() +
scale_color_manual(values=c("grey40"))+
scale_fill_manual(values=c("yellow3","dodgerblue3"))+
coord_polar(theta="y") +
coord_polar(theta="y") +
xlim(c(2.5, 4)) +
theme_void() +
scale_colour_hue(l = 20, c = 100)+
theme(legend.position = "none")
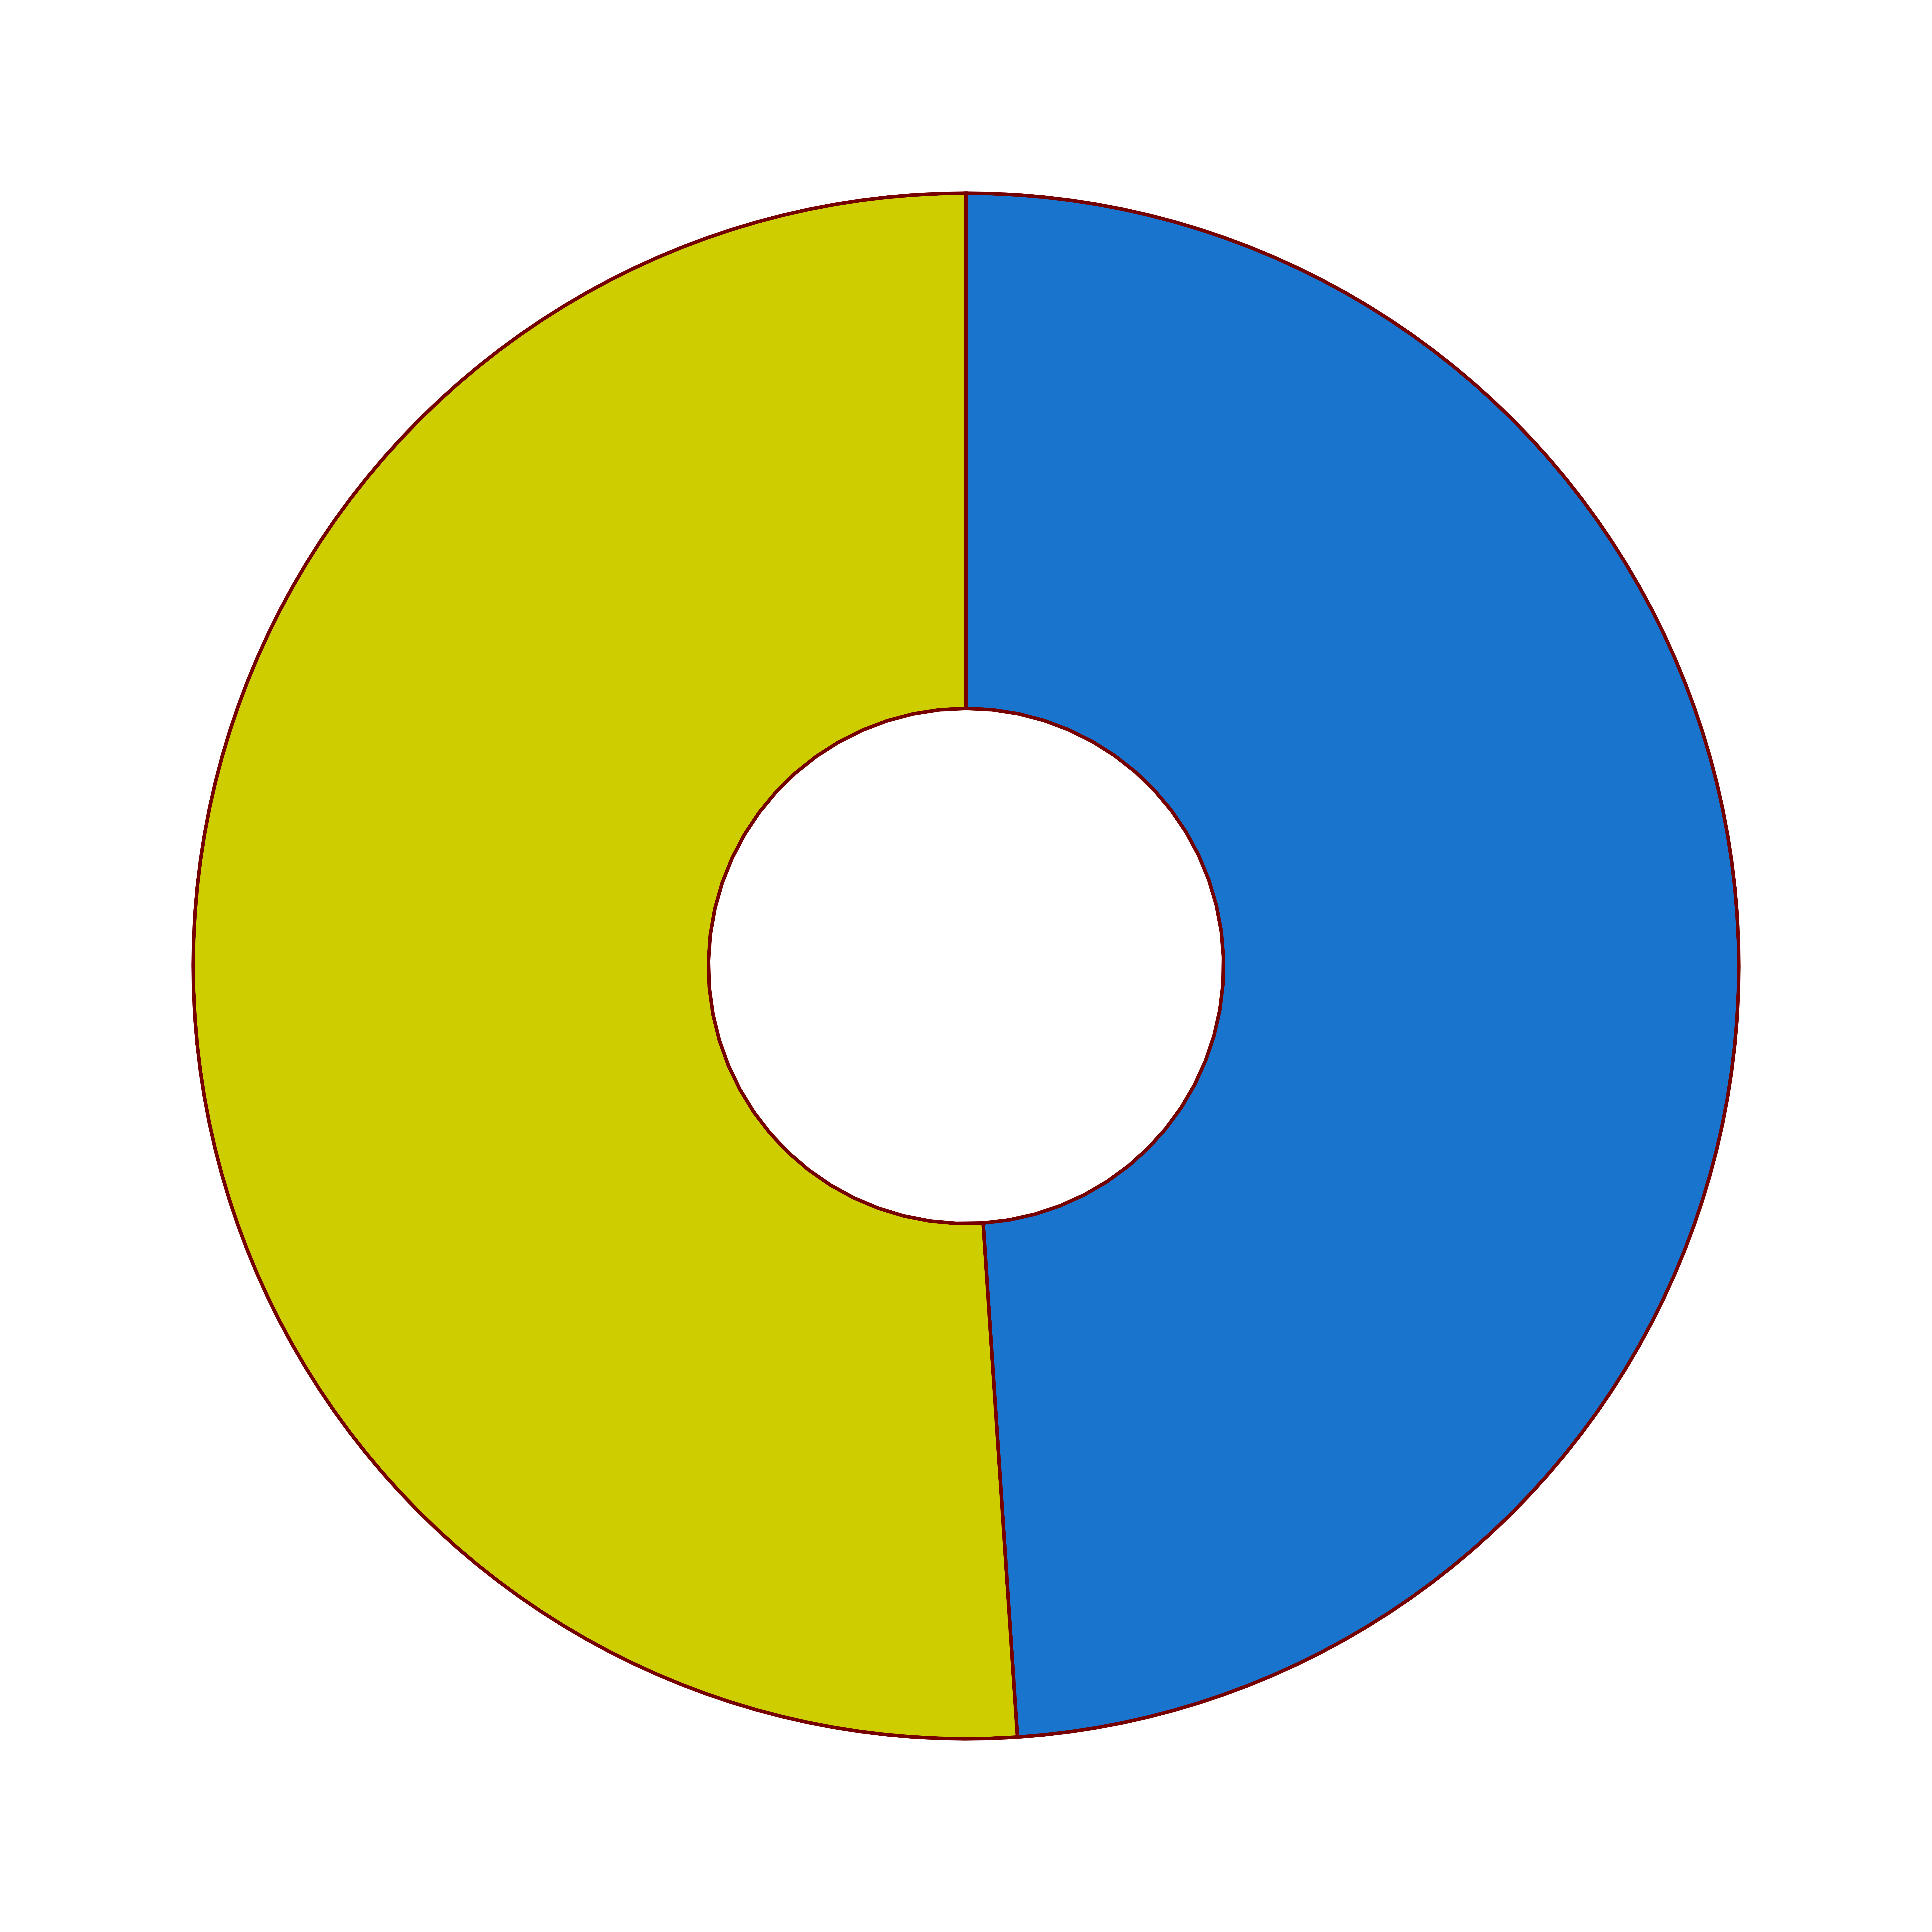
options(repr.plot.width = 8, repr.plot.height = 8, repr.plot.res = 1000, repr.plot.pointsize = 10)

data <- data.frame(
    category=c("B","A"),
    count=c(round(nrow(OM_A)/(nrow(OM_A)+nrow(OM_B))*100,2),
            round(nrow(OM_B)/(nrow(OM_A)+nrow(OM_B))*100,2))
)

data$fraction <- data$count / sum(data$count)
data$ymax <- cumsum(data$fraction)
data$ymin <- c(0, head(data$ymax, n=-1))
data$labelPosition <- (data$ymax + data$ymin) / 2

data$label <- paste0(data$category, "\n value: ", data$count)
nb.cols <- 19
mycolors <- colorRampPalette(brewer.pal(8, "Pastel2"))(nb.cols)

ggplot(data, aes(ymax=ymax, ymin=ymin, xmax=4, xmin=3, color = "grey",fill=category)) +
geom_rect() +
scale_color_manual(values=c("grey40"))+
scale_fill_manual(values=c("yellow3","dodgerblue3"))+
coord_polar(theta="y") +
coord_polar(theta="y") +
xlim(c(2.5, 4)) +
theme_void() +
scale_colour_hue(l = 20, c = 100)+
theme(legend.position = "none")