Stage1_UP_GO = read.table("/Ets1/ProcessedData/Stage1_UP_GO.txt", sep = "\t", header=T,fill = TRUE)
GENE_to_EpiSignal = read.table("/Ets1/ProcessedData/GENE_to_EpiSignal.txt", sep = "\t", header=T,fill = TRUE)

reg_gene_GO_bone = rbind(Stage1_UP_GO[grepl("ossification",Stage1_UP_GO[,2]), ],
                         Stage1_UP_GO[grepl("osteoblast differentiation",Stage1_UP_GO[,2]), ],
                         Stage1_UP_GO[grepl("Wnt",Stage1_UP_GO[,2]), ],
                         Stage1_UP_GO[grepl("bone",Stage1_UP_GO[,2]), ])

reg_gene_GO_bone = reg_gene_GO_bone[!grepl("regulation",reg_gene_GO_bone[,2]), ]
reg_gene_GO_bone = reg_gene_GO_bone[!grepl("propliferation",reg_gene_GO_bone[,2]), ]
reg_gene_GO_bone = unique(reg_gene_GO_bone)
reg_gene_GO_bone = reg_gene_GO_bone[order(-reg_gene_GO_bone$richFactor),]

reg_gene_GO_bone_gene = as.data.frame(strsplit(reg_gene_GO_bone[1,11], split = '/'))
colnames(reg_gene_GO_bone_gene) = "gene"
reg_gene_GO_bone_gene = unique(reg_gene_GO_bone_gene)

for(i in 1:nrow(reg_gene_GO_bone)){
reg_gene_GO_bone_gene_frag = as.data.frame(strsplit(reg_gene_GO_bone[i,11], split = '/'))
colnames(reg_gene_GO_bone_gene_frag) = "gene"
reg_gene_GO_bone_gene_frag = unique(reg_gene_GO_bone_gene_frag)
reg_gene_GO_bone_gene = rbind(reg_gene_GO_bone_gene,reg_gene_GO_bone_gene_frag)
    }

reg_gene_GO_bone_gene = unique(reg_gene_GO_bone_gene)

reg_gene_GO_bone_gene_to_signal = inner_join(GENE_to_EpiSignal,reg_gene_GO_bone_gene,by="gene")
reg_gene_GO_bone_gene_to_signal = na.omit(reg_gene_GO_bone_gene_to_signal)
reg_gene_GO_bone_gene_to_signal = reg_gene_GO_bone_gene_to_signal[,c(1:4,12:19,23:29,31)]
options(repr.plot.width = 8, repr.plot.height = 8, repr.plot.res = 1000, repr.plot.pointsize = 10)
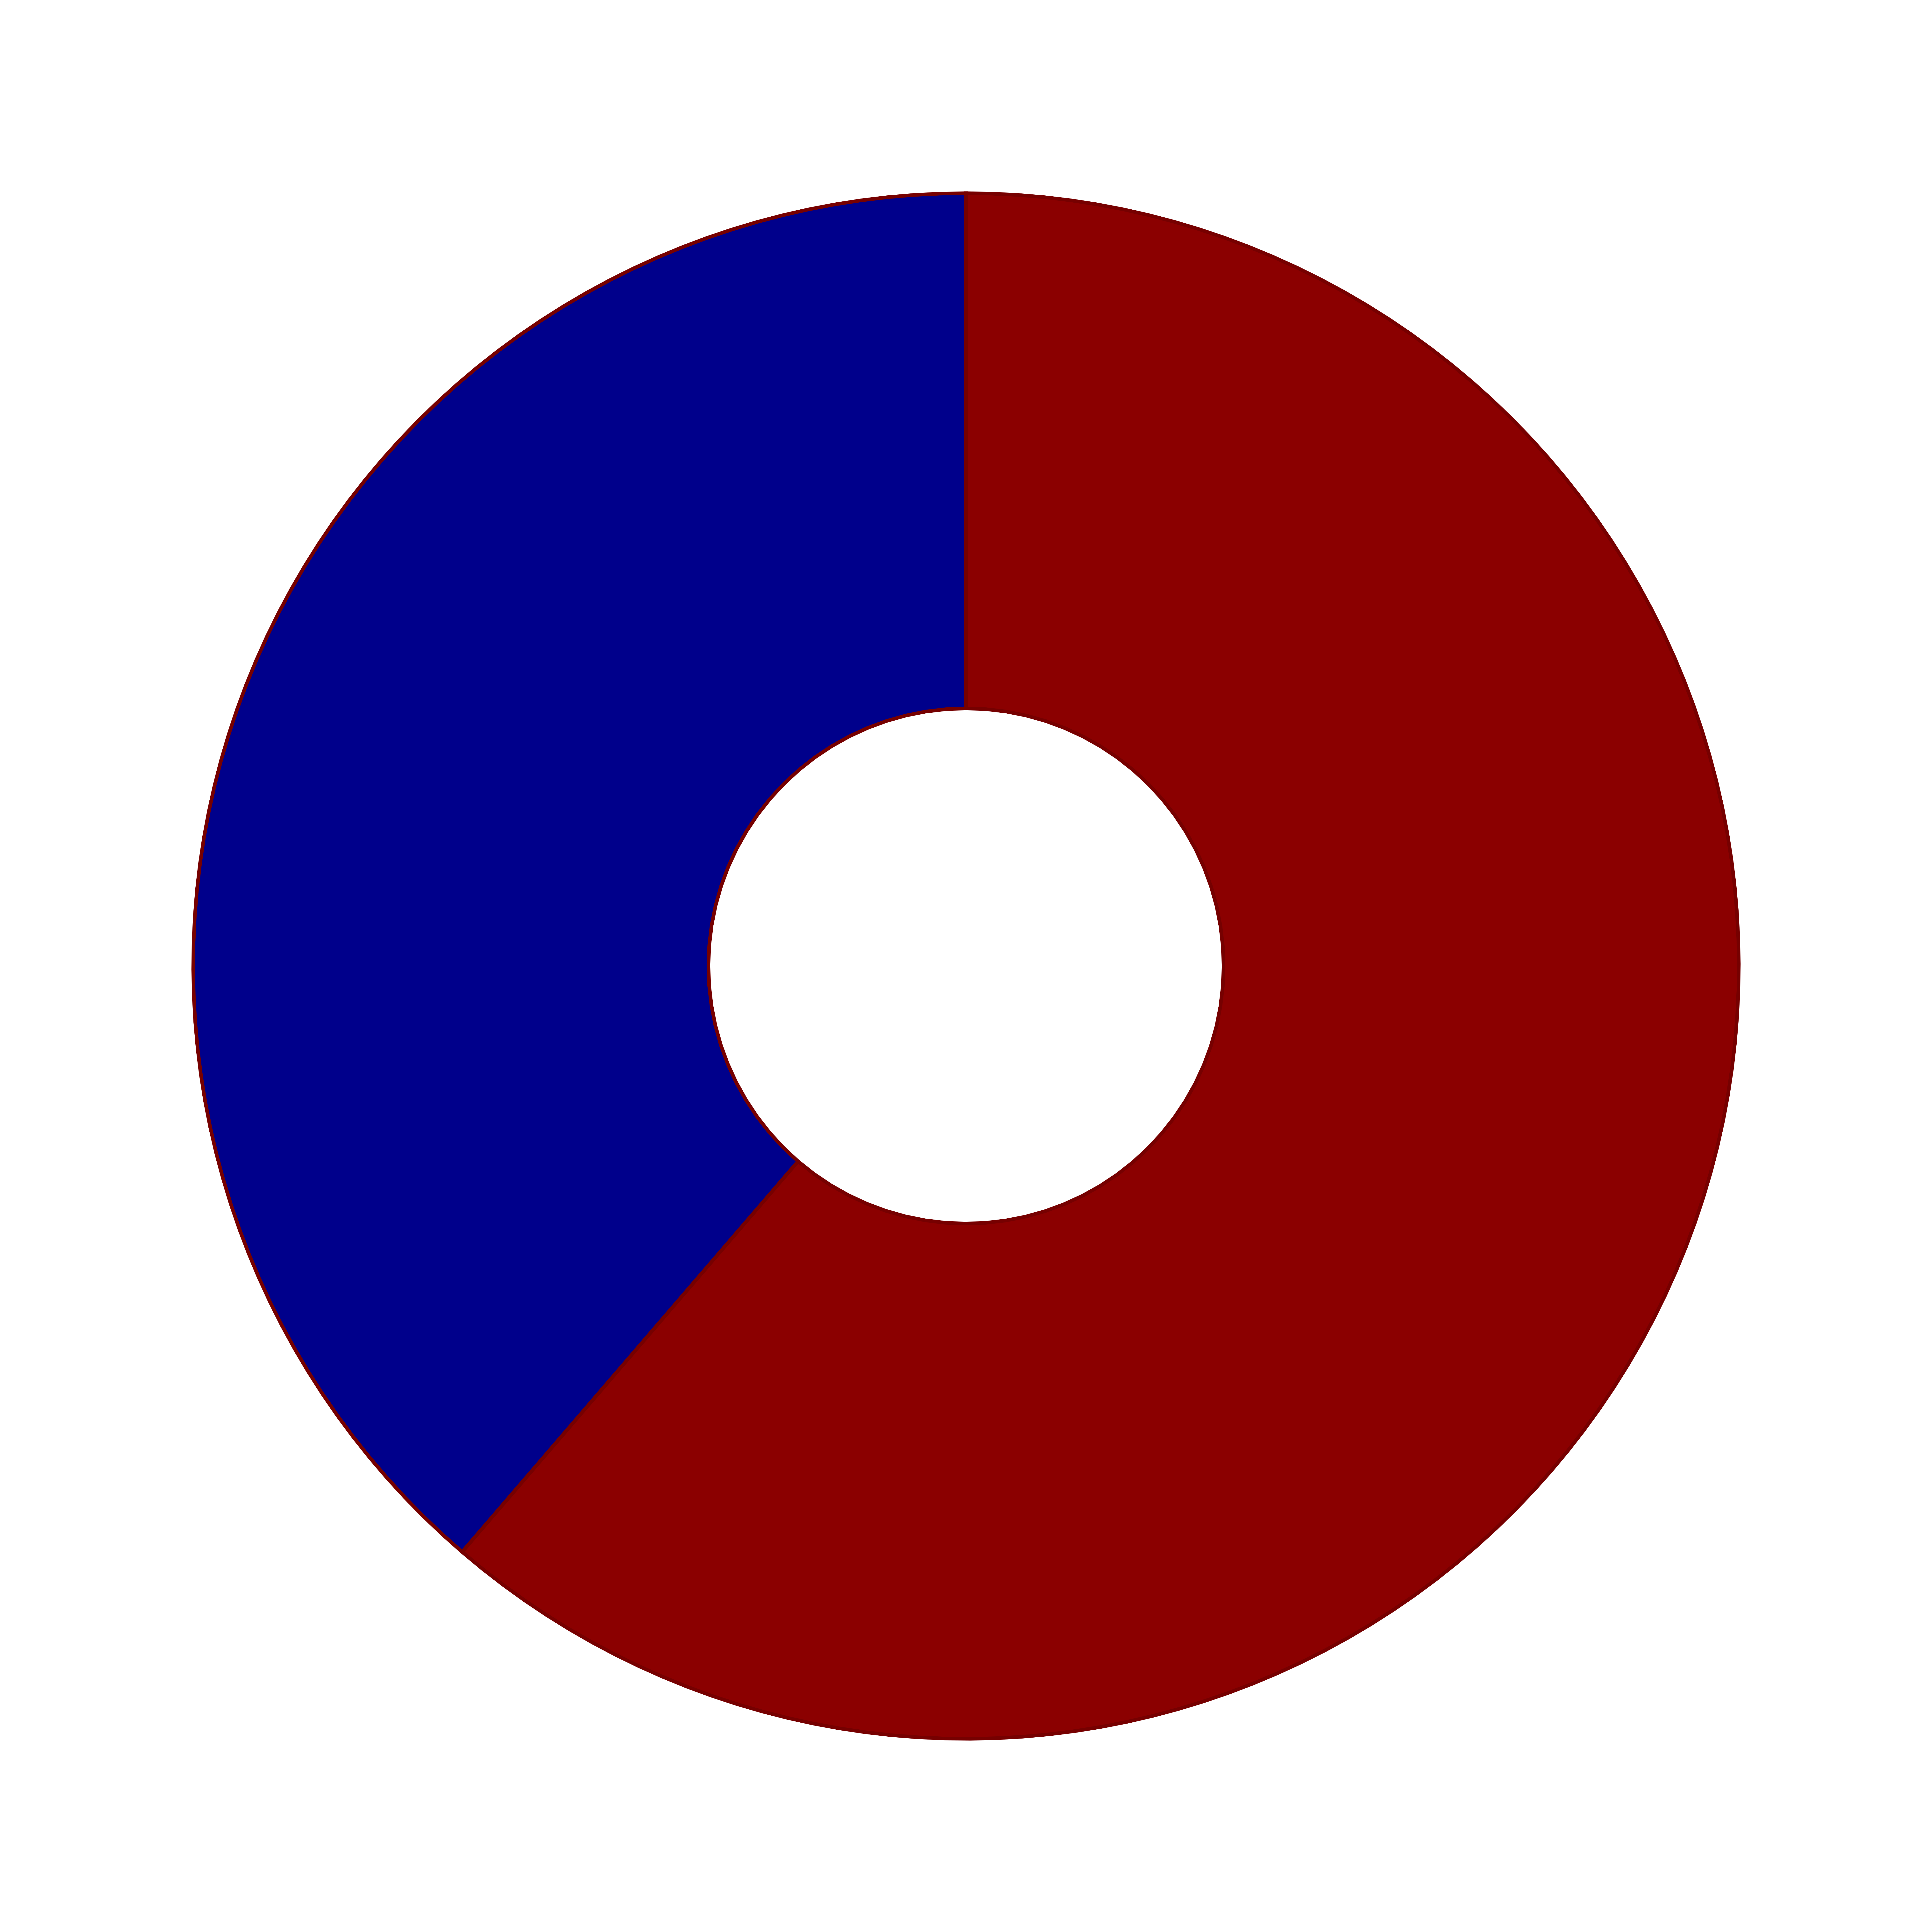
data = data.frame(
category=c("towardA","towardB"),
count=c(nrow(reg_gene_GO_bone_gene_to_signal[which(reg_gene_GO_bone_gene_to_signal$ABStatus == "towardA"),]),
nrow(reg_gene_GO_bone_gene_to_signal[which(reg_gene_GO_bone_gene_to_signal$ABStatus == "towardB"),])))
data$fraction = data$count / sum(data$count)
data$ymax = cumsum(data$fraction)
data$ymin = c(0, head(data$ymax, n=-1))
data$labelPosition = (data$ymax + data$ymin) / 2
data$label = paste0(data$category, "\n value: ", data$count)
nb.cols = 19
mycolors = colorRampPalette(brewer.pal(8, "Pastel2"))(nb.cols)
ggplot(data, aes(ymax=ymax, ymin=ymin, xmax=4, xmin=3, color = "grey",fill=category)) +
geom_rect() +
scale_color_manual(values=c("grey40"))+
scale_fill_manual(values=c("darkred","darkblue"))+
coord_polar(theta="y") +
coord_polar(theta="y") +
xlim(c(2.5, 4)) +
theme_void() +
scale_colour_hue(l = 20, c = 100)+
theme(legend.position = "none")